PRODUCT
- Chlorophyll analyzer
- Photosynthesis analyzer
- Leaf area measuring instrument
- Plant canopy analyzer
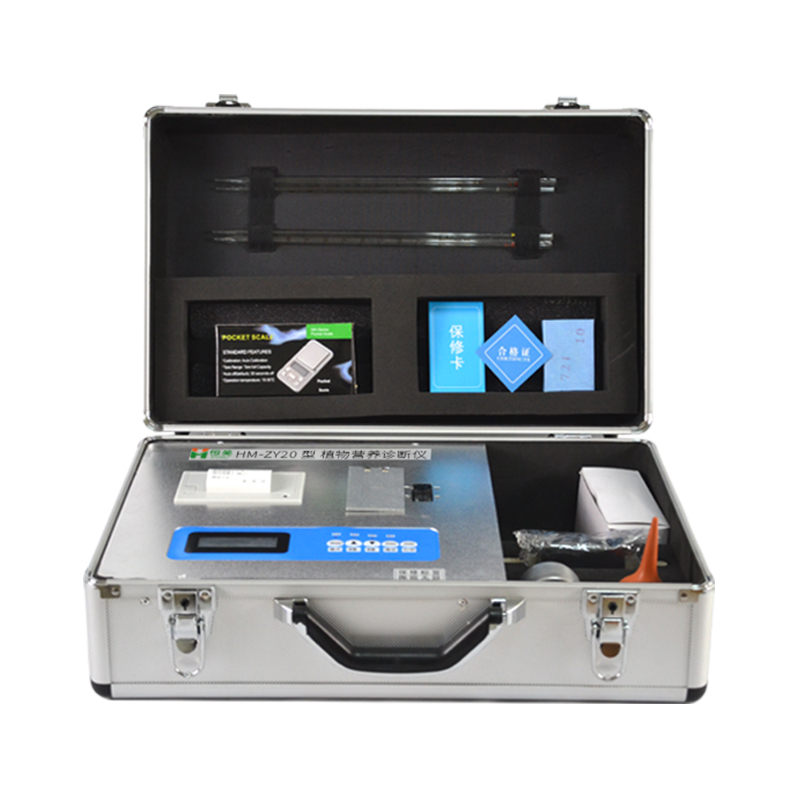
- Plant nutrition diagnostic instrument
- Plant Root Analysis System
- Plant water potential analyzer
- Fruit and vegetable respiration tester
- Transpiration rate measuring instrument
- Tree ring analyzer
- Plant stem flow meter
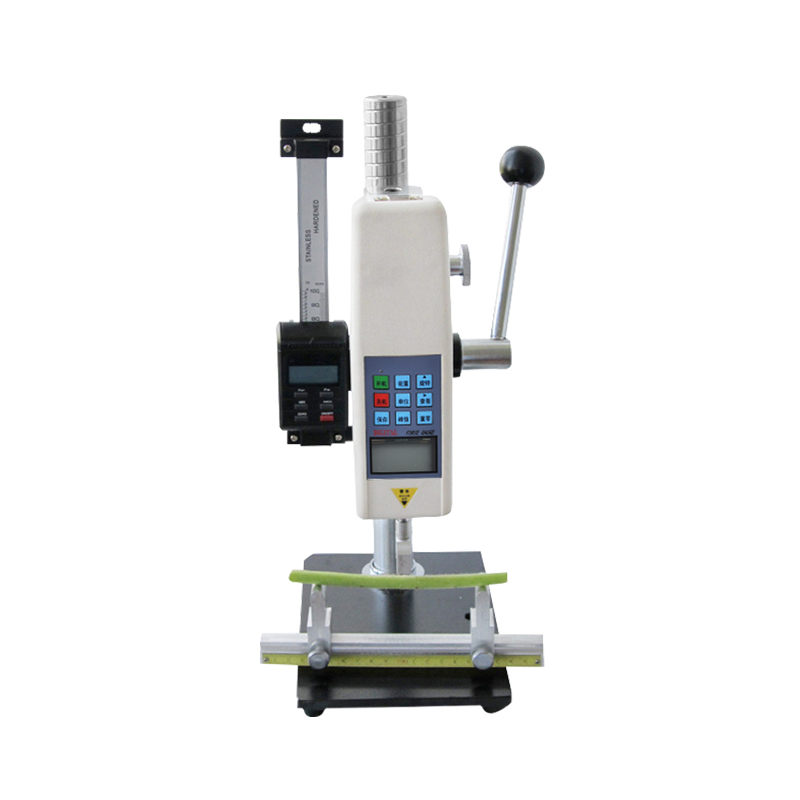
- Fruit hardness tester
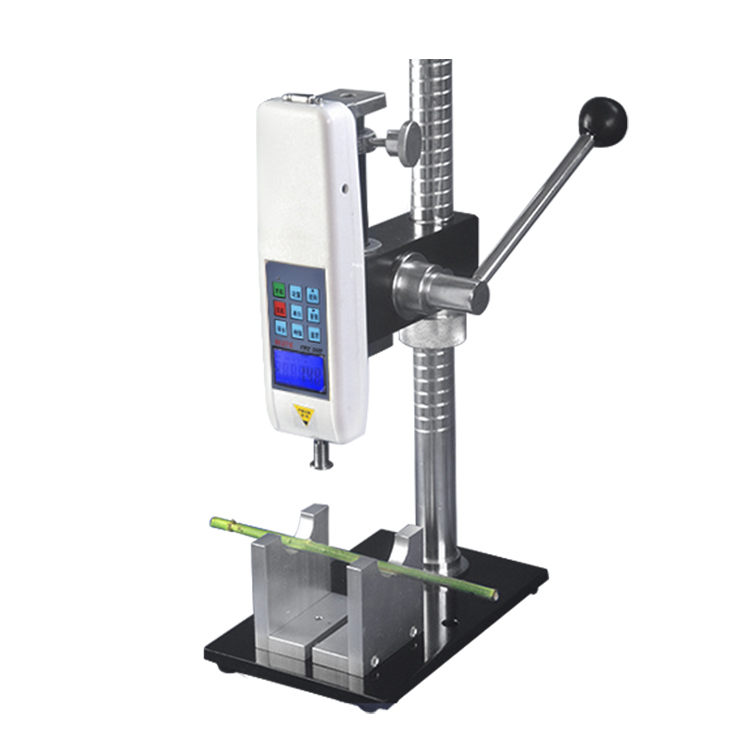
- Plant lodging resistance tester
- Plant stem strength tester
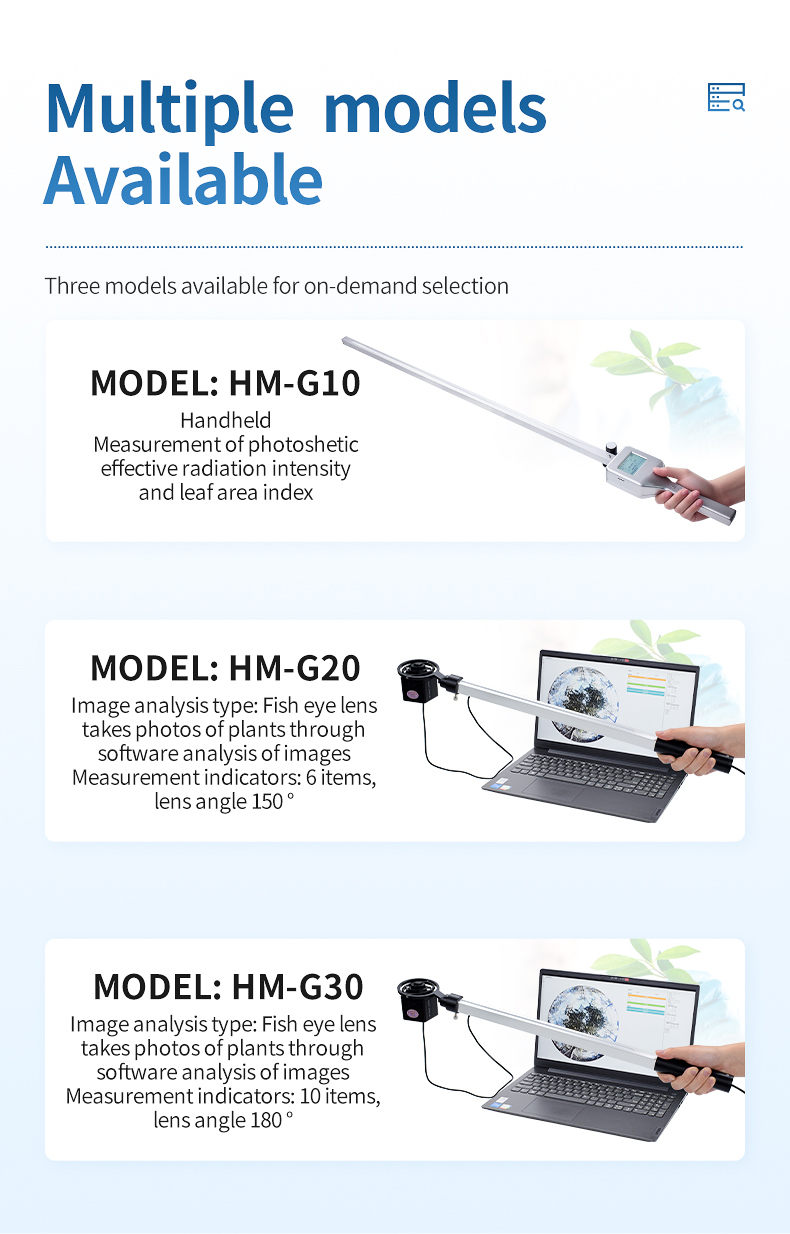
Plant Canopy Image Analyzer
Model: HM-G30
 +86
17853698681
+86
17853698681Product details
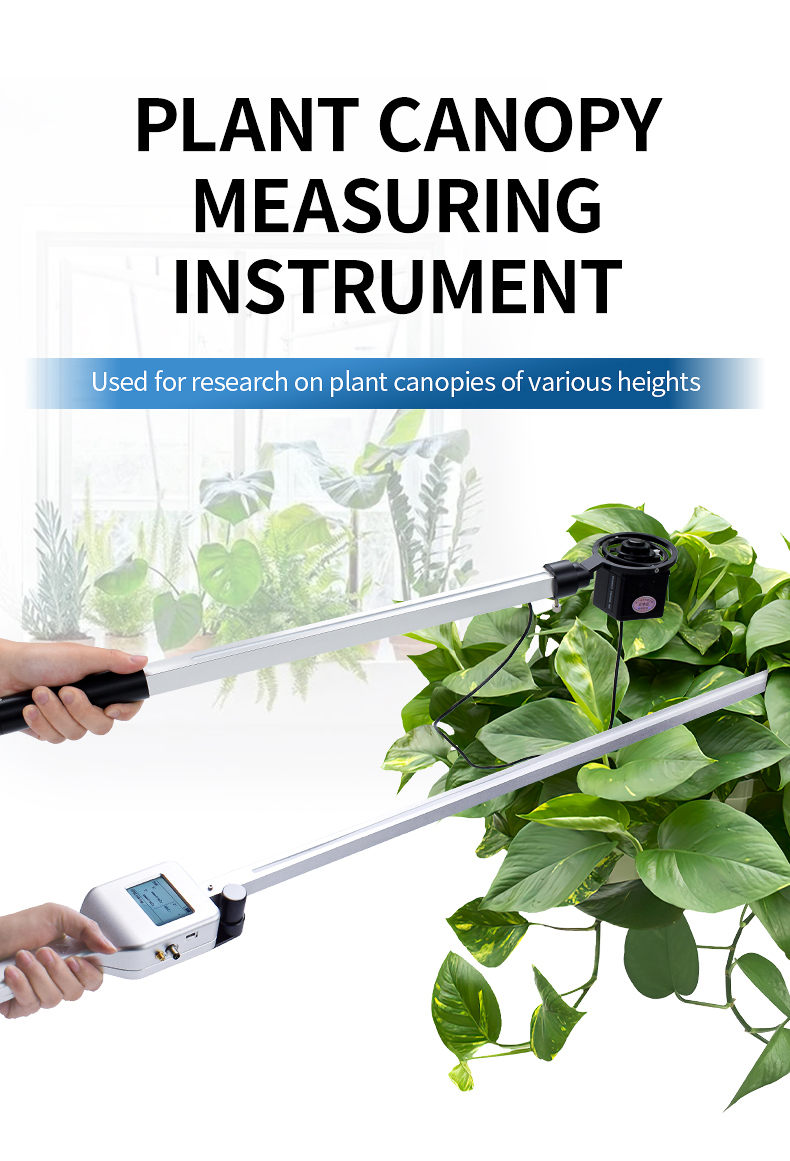

Purpose
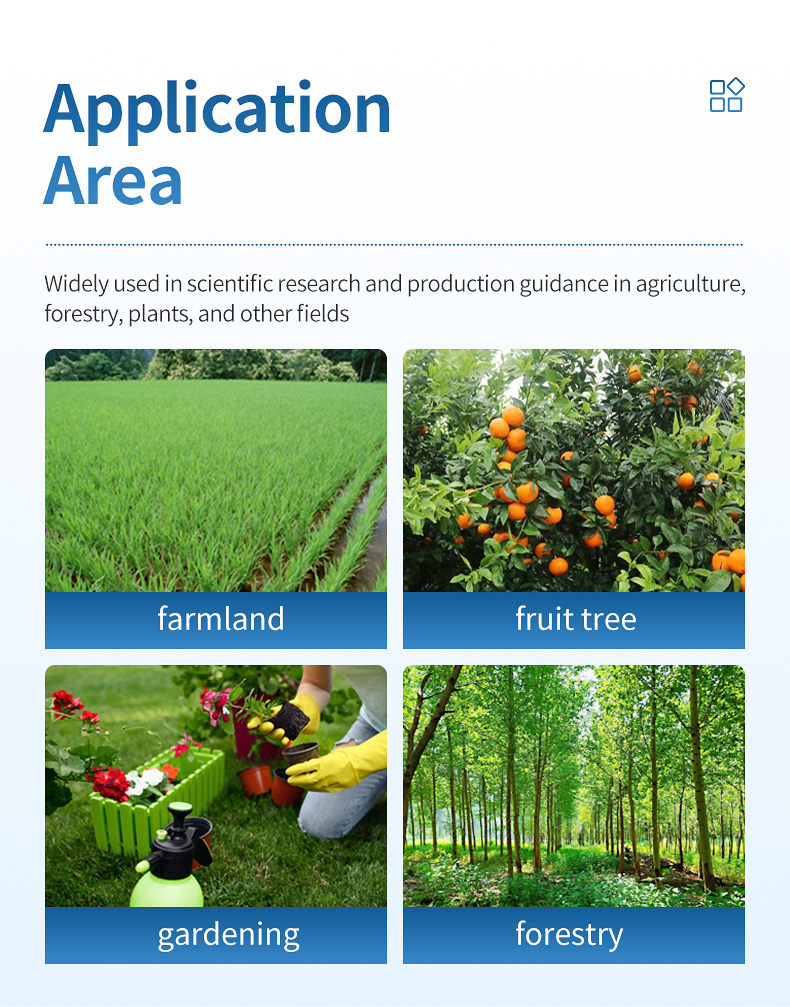
The plant canopy image analyzer extracts canopy gap rates from multiple angles using various image processing methods. It uses a camera equipped with a fisheye lens to take canopy photos from below to above, and uses gap rate parameters to invert various canopy parameters. This provides reliable scientific basis for rational fertilization and efficient management of modern farms, and is widely used in scientific research and production guidance in agriculture, forestry, plants, and other fields.
Testing principles and methods
The plant canopy image analyzer adopts the principle of correlation between canopy porosity and canopy structure. It is based on the Beer's law of attenuation of light passing through a medium, and defines a series of assumptions for the plant canopy. Using a semi theoretical and semi empirical formula, the canopy structure parameters are calculated by measuring the canopy porosity. This is the principle unanimously adopted by various canopy instruments around the world. Under the above principle, the plant canopy image analyzer adopts the method of analyzing and measuring the canopy porosity of the hemisphere image under the canopy, which is the most accurate, labor-saving, time-saving, and convenient method among various methods.
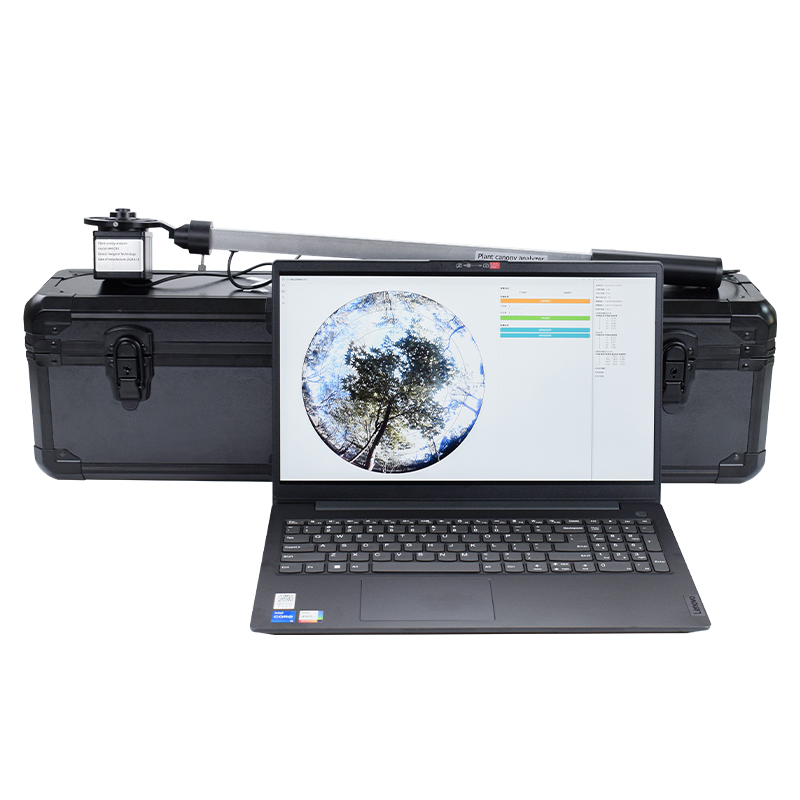
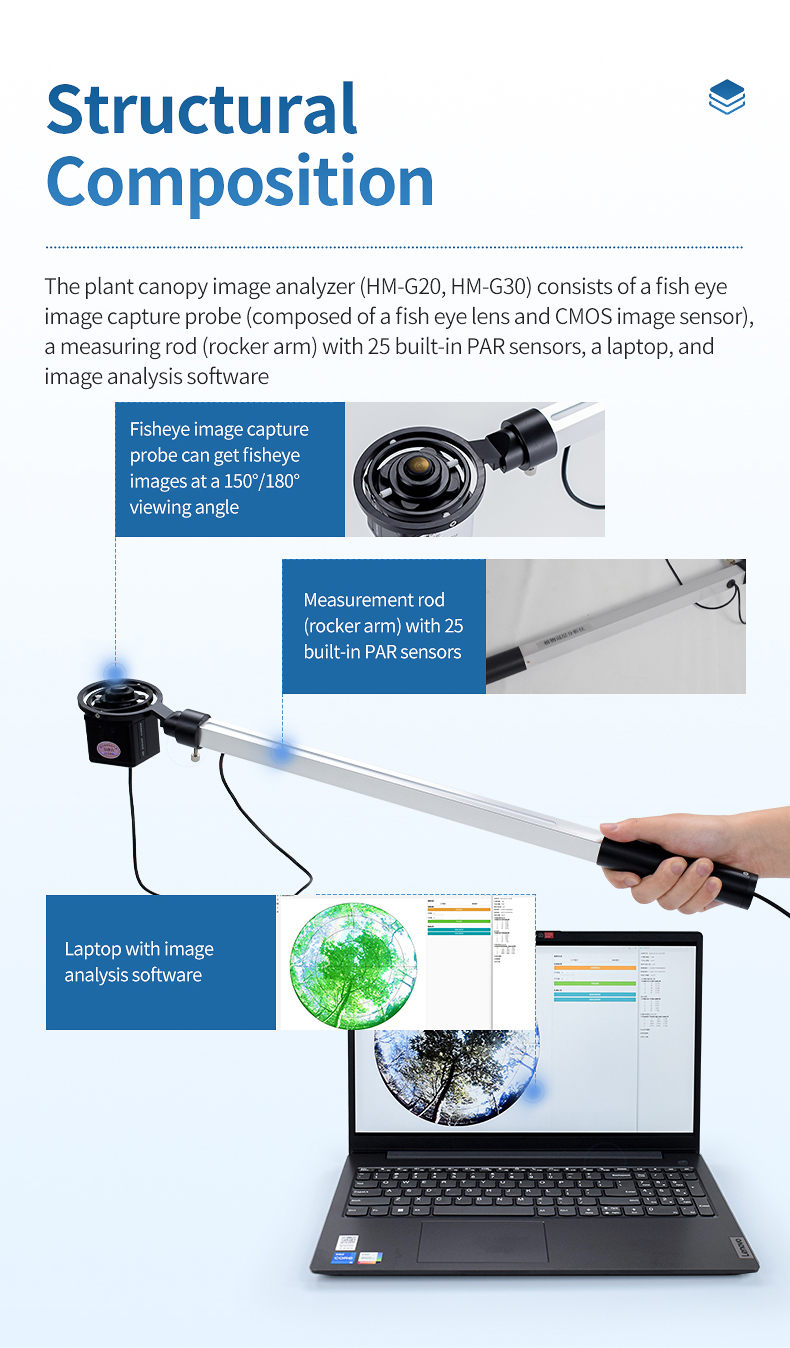
Structural composition
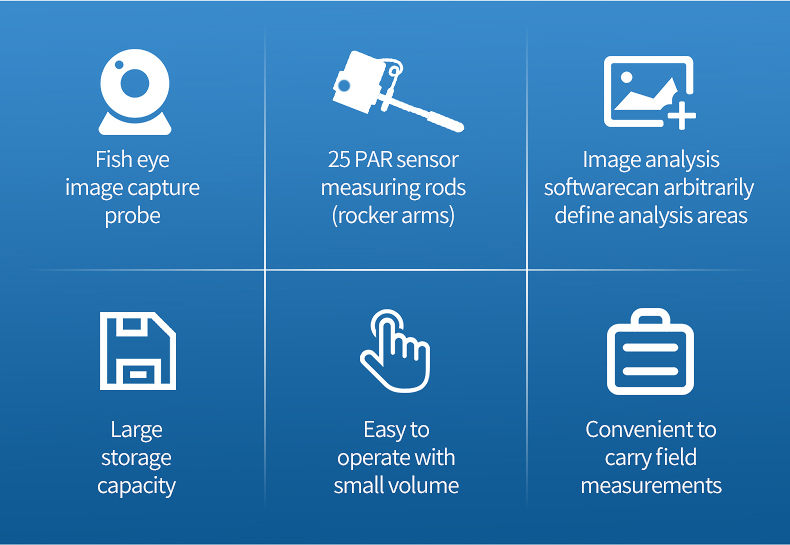
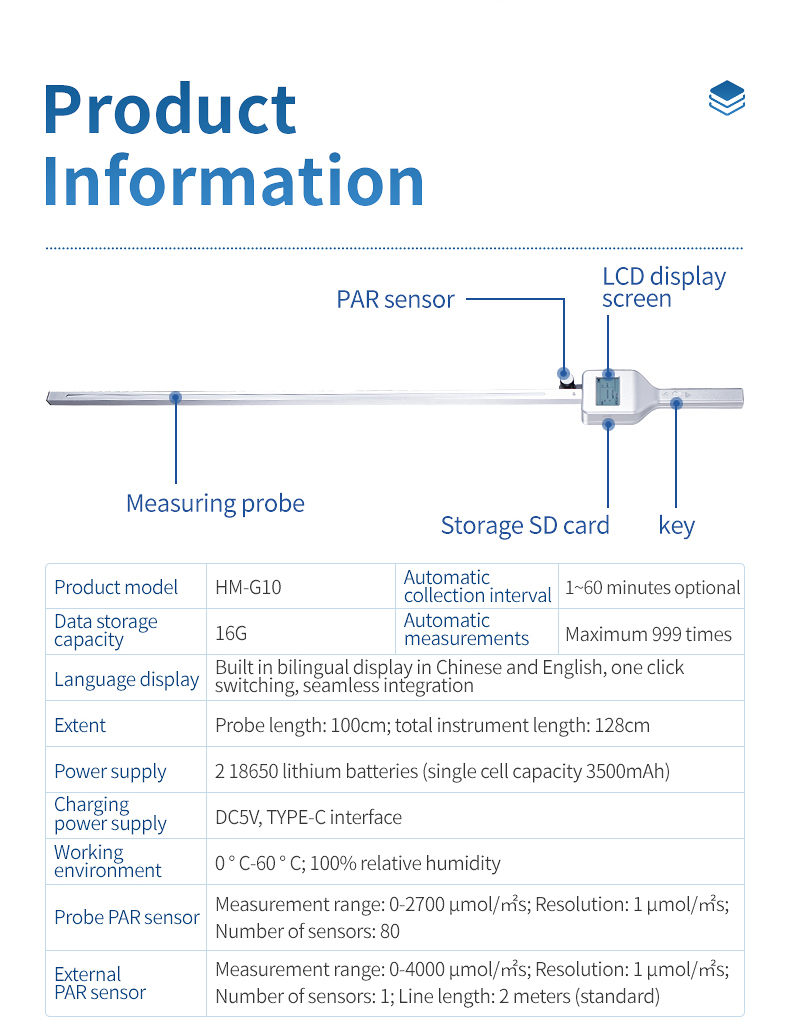
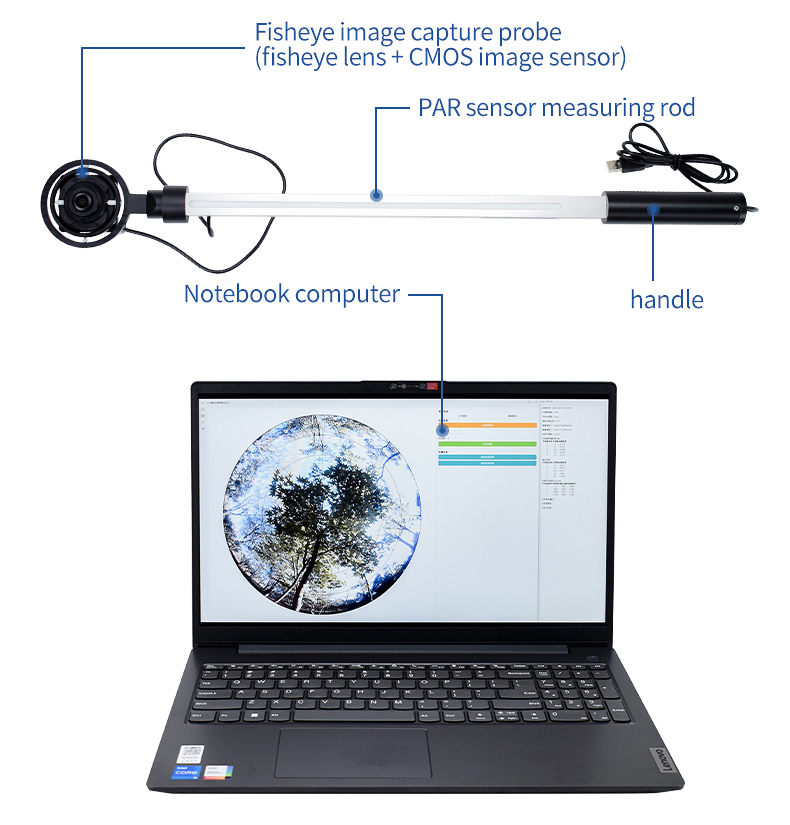
The plant canopy image analyzer consists of a fisheye image capture probe (composed of a fisheye lens and a CMOS image sensor), a measuring rod (rocker arm) with 25 built-in PAR sensors, a laptop, and image analysis software. The fisheye probe is installed at the top of a lightweight rocker arm and can capture fisheye images from a 180 ° perspective. The display and storage of images are completed by the configured laptop computer.
Technical indicators
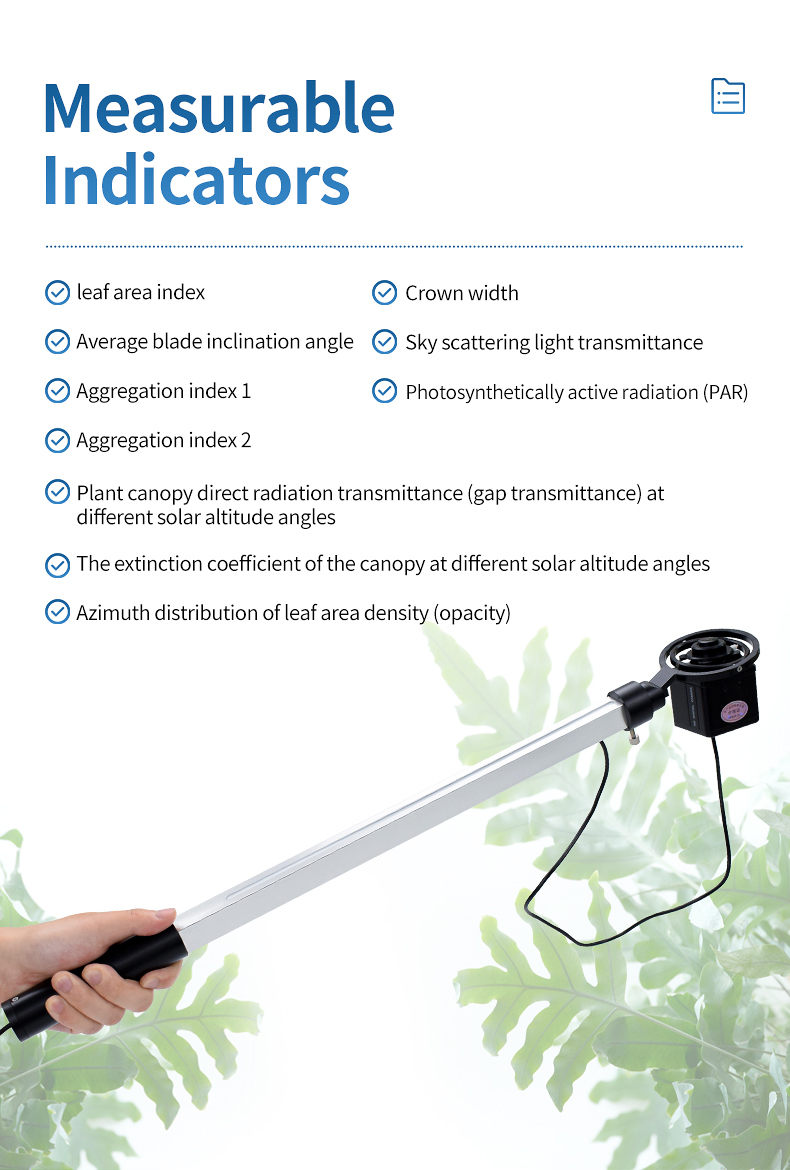
1. Measurable indicators:
Leaf Area Index (LAI)
Mean inclination angle of blades (MTA)
Aggregation Index 1 (ACF)
Aggregation Index 2 (ACF)
Crown width (DIFN)
Sky scattered light transmittance
Plant canopy direct radiation transmittance (gap transmittance) at different solar altitude angles
Extinction coefficient of canopy at different solar altitude angles
Directional distribution of leaf area density (opacity)
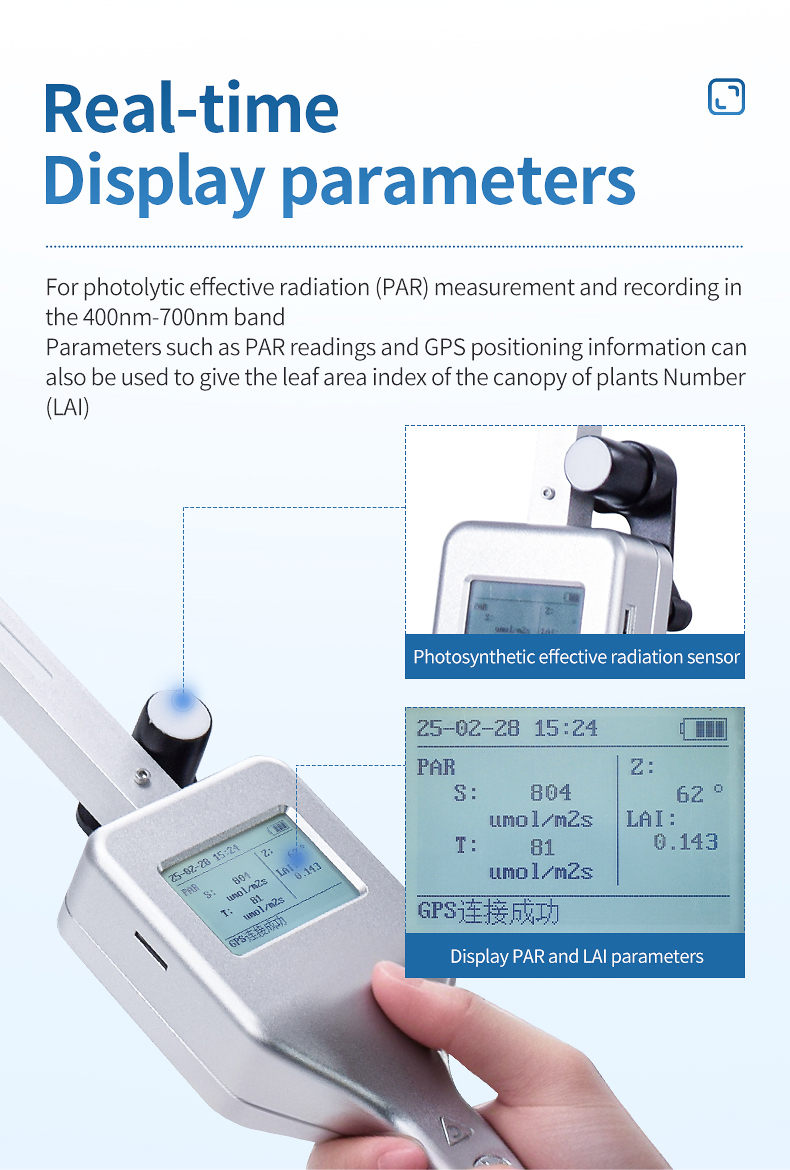
Photosynthetically active radiation (PAR)
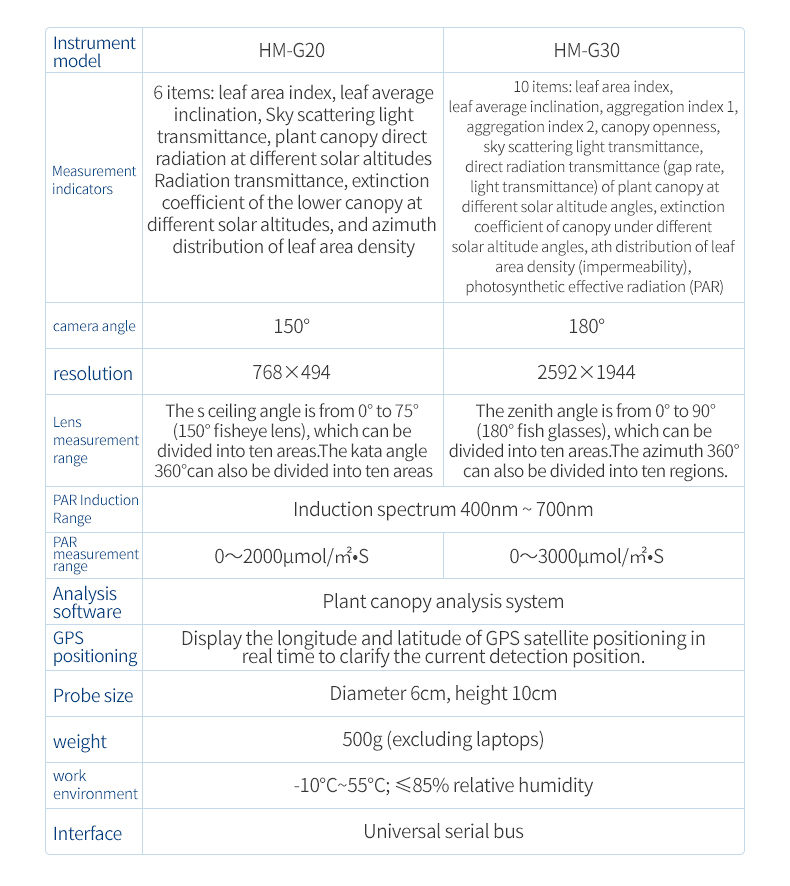
2. Camera angle: 180 °
3. Resolution: 2592 × 1944
4. Measurement range: The zenith angle can be divided into ten regions from 0 ° to 90 ° (180 ° fisheye lens), and the azimuth angle of 360 ° can also be divided into ten regions
5. PAR sensing range: sensing spectrum from 400nm to 700nm
6. Measurement range: 0-3000 μ mol/㎡• S
7. Analysis software: Plant canopy analysis system
8. Weight: 500g
9. Working and storage environment: -10 ℃~55 ℃ ≤ 85% relative humidity
10. Transmission interface: USB
Functional features
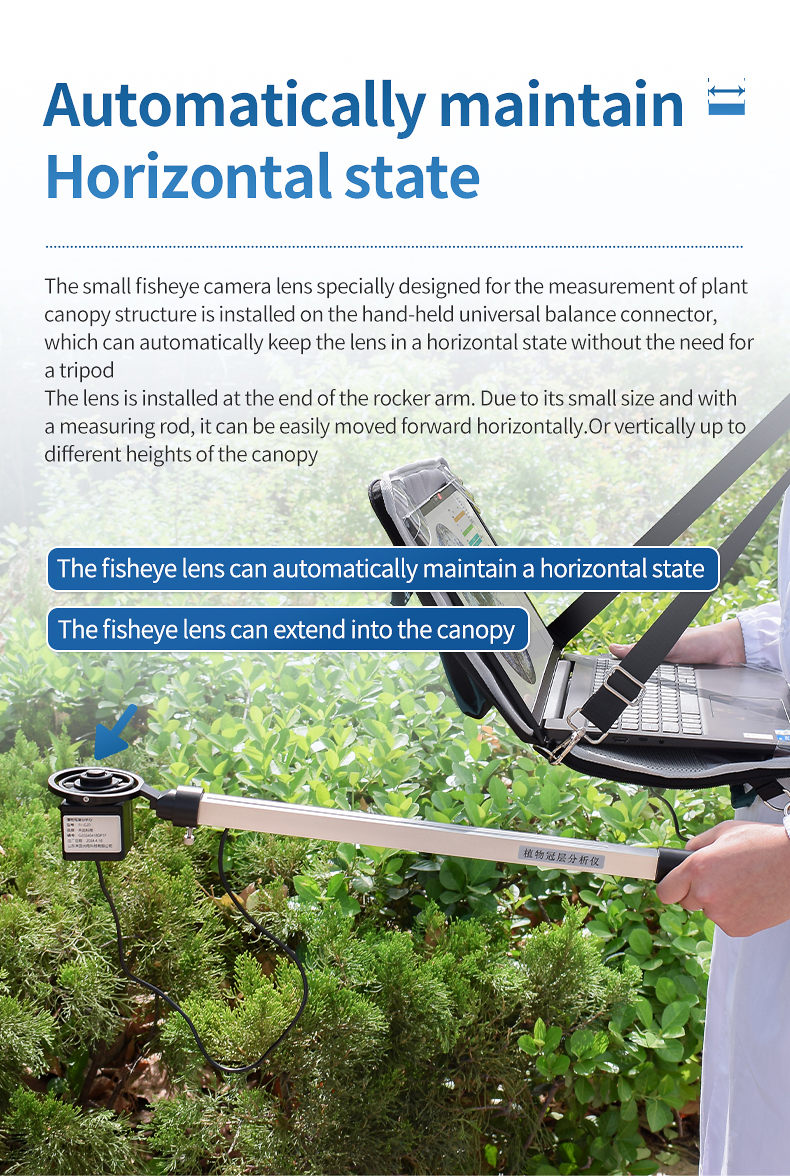
1. Fish eye lens can automatically maintain a horizontal state: A small fish eye camera lens specially designed for measuring plant canopy structure is installed on a handheld universal balance joint, which can automatically maintain the lens in a horizontal state without the need for a tripod;
2. Fisheye lenses can be extended into the canopy: the lens is installed at one end of the rocker arm, and due to its small size and measuring rod, it can be easily extended horizontally or vertically to different heights of the canopy for rapid layered measurement, measuring the vertical distribution of light transmittance and leaf area index within the population;
3. Image analysis software: Image analysis software can define any image analysis area (zenith angle can be divided into 10 zones, azimuth angle can be divided into 10 zones).
4. Can shield unreasonable canopy parts: When conducting regional analysis of canopy in different directions, it is possible to shield any ground features and unreasonable canopy parts (such as missing plants, edge row problems, etc.) at will.
5. Automated threshold adjustment to avoid subjective threshold settings leading to increased errors
6. Real time display of GPS satellite positioning latitude and longitude, clarifying the current detection location
7. The test results can be directly transmitted to a dedicated cloud agriculture data center, equipped with a dedicated cloud agriculture data center account
8. Data browsing: can browse historical data
9. Built in bilingual display in Chinese and English, one click switch
10. The software is only compatible with Windows 10 and above systems.
Article address:http://www.plantinstrument.com/pro4/55.html
- Previous: Plant Canopy Analyzer
- Next: no more
Related products

Related articles
-
Plant Stem Strength Tester Product Knowledge Graph White Paper
2025-12-22 -
Chlorophyll Meter: Non-Destructive Plant Health Detection
2025-09-08 -
Leaf Area Analyze: Portable & Efficient Measurement for Plants
2025-09-23 -
Leaf Area Index Meter: A Core Tool for Unlocking Vegetation Productivity
2025-07-29 -
HM-GH3 Plant Photosynthesis Analyzer Product Knowledge Graph White Paper
2025-11-06 -
How can plant canopy image analyzers empower modern farm management?
2025-07-29 -
Photosynthesis analyzer: the core technical equipment for decoding plant life activities
2025-07-29 -
Handheld Leaf Area Meter - Portable Plant Measurement
2025-10-23